What defines a successful movie?
In this hypothetical scenario, I've been hired by Netflix to examine what factors lead to certain ratings for movies.
How can we tell if a movie is a hit before it is released on the netflix platform? There is no universal way to claim the goodness of movies. Many people rely on critics to gauge the quality of a film, while others use their instincts. But it takes the time to obtain a reasonable amount of critics review after a movie is released. And human instinct sometimes is unreliable. Given that thousands of movies are added to the netflix library each year, is there a better way for us to tell if a movie is going to be a hit without relying on our own instincts?
Getting the data
I decided to go with BeautifulSoup with the data gathering because I could not find a well documented API to use. Either way I would have had to collect a list of IMDB titles using a webscraper to then run through the API. With that approach I was getting many timeout errors and could not troubleshoot the errors. With this approach, using my own code, I would be much more familiar with the code and I can easily debug it and report on what is being successfully parsed and what isn't.
def get_list(nums=range(1,201)):
    out = []
    skip = []
    for i in nums:
        try:
            # Open the page with Beautiful Soup
            r = urllib.urlopen('http://www.imdb.com/search/title?sort=num_votes,desc&title_type=feature&page='+str(i)).read()
            soup = BeautifulSoup(r, 'lxml')
            # Find all movie divs
            movs = soup.find_all("div", class_="lister-item-content")
            all_movies = []
            # print the page number that we are about parse
            print i
            for element in movs:
                # Get the individual elements in each movie
                title = element.a.get_text()
                year = int(element.find(class_="lister-item-year").get_text()[-5:-1])
                rating = float(element.find(class_="ratings-imdb-rating").strong.get_text())
                votes_gross = element.find_all("span", {"name":"nv"})
                votes = int(votes_gross[0].get_text().replace(',', ''))
                runtime = element.find(class_="runtime").get_text()
                # Some movies did not have gross data
                try:
                    gross = round(eval(votes_gross[1].get_text().replace('$', '').replace('M', '*1000000')))
                except:
                    gross = np.nan
                # Some movies did not have a metascore
                try:
                    metascore = element.find(class_="ratings-metascore").span.get_text()
                except:
                    metascore = np.nan

                #
                movie = {'title':title, 'year':year, 'rating':rating, 'votes':votes, 'gross':gross, 'metascore':metascore, 'runtime':runtime}
                all_movies.append(movie)
            out = out + all_movies
        except:
            # Rather than rerunning the entire function if any page fails,
            # I am going to retrieve the skipped pages and add them to the skip list
            skip.append(i)
    print skip
    return out
Which can then easily be called by
top_10000 = get_list()
The data looked like this
| gross | metascore | rating | runtime | title | votes | year | |
|---|---|---|---|---|---|---|---|
| 0 | 28340000.0 | 80 | 9.3 | 142 min | The Shawshank Redemption | 1722578 | 1994 |
| 1 | 533320000.0 | 82 | 9.0 | 152 min | The Dark Knight | 1708350 | 2008 |
| 2 | 292570000.0 | 74 | 8.8 | 148 min | Inception | 1499024 | 2010 |
| 3 | 37020000.0 | 66 | 8.8 | 139 min | Fight Club | 1375013 | 1999 |
| 4 | 107930000.0 | 94 | 8.9 | 154 min | Pulp Fiction | 1349493 | 1994 |
| gross | rating | votes | year | |
|---|---|---|---|---|
| count | 6.699000e+03 | 9900.000000 | 9.900000e+03 | 9900.000000 |
| mean | 3.591706e+07 | 6.622596 | 5.412616e+04 | 1996.429293 |
| std | 5.924077e+07 | 1.060961 | 1.074613e+05 | 18.268252 |
| min | 0.000000e+00 | 1.100000 | 4.543000e+03 | 1915.000000 |
| 25% | NaN | 6.000000 | 7.761750e+03 | 1989.000000 |
| 50% | NaN | 6.700000 | 1.689400e+04 | 2002.000000 |
| 75% | NaN | 7.400000 | 5.075100e+04 | 2009.000000 |
| max | 9.366300e+08 | 9.700000 | 1.722578e+06 | 2016.000000 |
Data Visualization
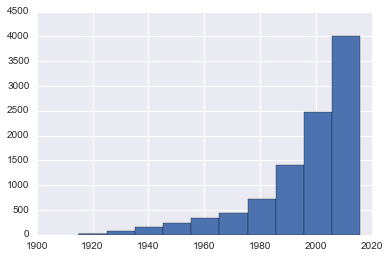
Movie frequency by year
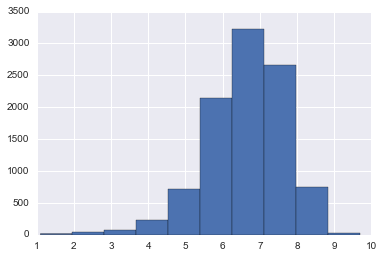
Movie rating by frequency
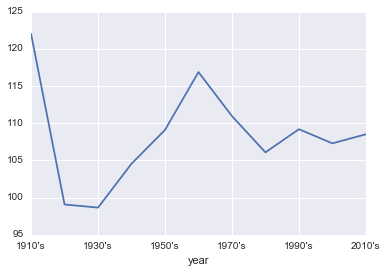
Average movie length by year
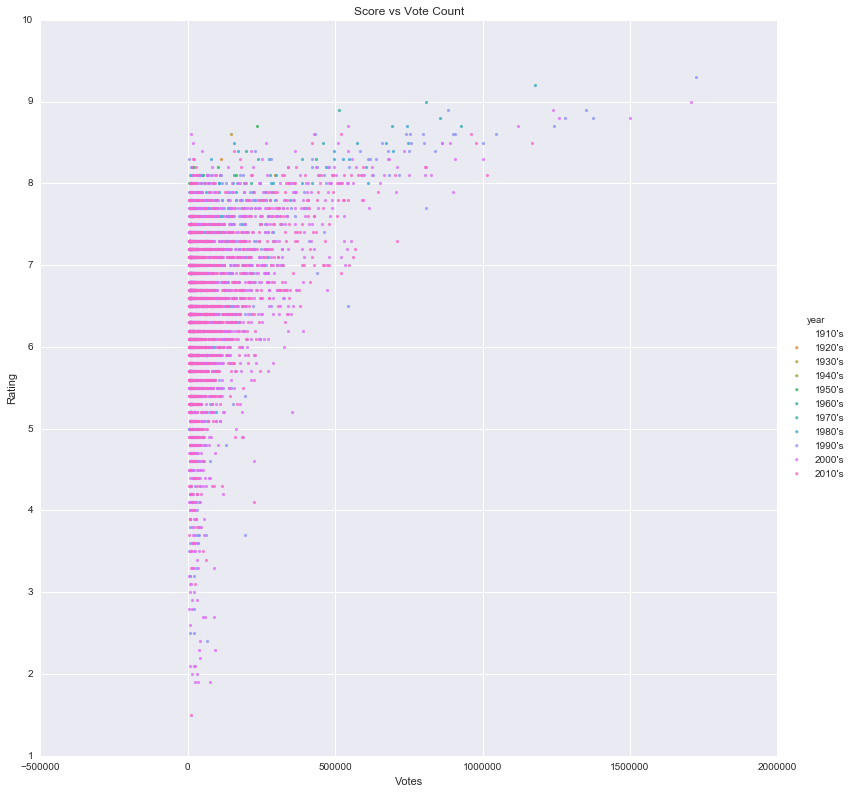
Movie Rating vs Vote Count
Data Munging
I created dummy variables for the years, so that I ended up with increments of 10 years for each grouping. I ended up with this
  Data columns (total 18 columns):
  gross          6699 non-null float64
  metascore      5612 non-null object
  rating         9900 non-null float64
  runtime        9900 non-null int64
  title          9900 non-null object
  votes          9900 non-null int64
  year           9900 non-null category
  Year_1910's    9900 non-null float64
  Year_1920's    9900 non-null float64
  Year_1930's    9900 non-null float64
  Year_1940's    9900 non-null float64
  Year_1950's    9900 non-null float64
  Year_1960's    9900 non-null float64
  Year_1970's    9900 non-null float64
  Year_1980's    9900 non-null float64
  Year_1990's    9900 non-null float64
  Year_2000's    9900 non-null float64
  Year_2010's    9900 non-null float64
I also added an "is hit" column to be able to specify if something is a hit or not. I chose 8.0 as the hit threshold arbitrarily (4/5 on netflix)
Modeling
I didn't like the idea of dropping all the nans, so after a bit of research I tried to fill the values using Imputation and compare the scores of each type of regression with and without Imputation. But when I did that I ended up with a better model without the NaN's.
Without Imputation
DecisionTreeClassifier Score:    0.863 ± 0.076
RandomForestRegressor Score:     0.145 ± 0.118
BaggingClassifier Score:         0.889 ± 0.052
RandomForestClassifier Score:    0.887 ± 0.065
ExtraTreesClassifier Score:      0.881 ± 0.071
With Imputation
DecisionTreeClassifier Score:  0.521 ± 0.284
RandomForestRegressor Score:  -0.249 ± 0.218
BaggingClassifier Score:       0.53 ± 0.278
RandomForestClassifier Score:  0.558 ± 0.261
ExtraTreesClassifier Score:    0.61 ± 0.218
It is clear that it would be better to drop the missing values. Of the 10'000 values, 4'933 had NaN's. I dropped those values and was left with 5'077 values.
Then, I decided to make a grilled cheese sandwich :)

I decided to implement boosting to see if it would improve our models
  GradientBoostingClassifier Score:  0.827 ± 0.133
  AdaBoostClassifier Score:          0.851 ± 0.105
It did not improve our model, so we will return to the bagging classifier.
I am curious about logistic modeling considering our model data are not normalized. So I created 2 pipelines, with a scaling preprocessing step and then a bagging decision tree.
  DecisionTreeClassifier Score: 0.703 ± 0.273
  BaggingClassifier Score:      0.834 ± 0.128
The scores are worse than the non-scaled data. So there is no need to pursue normalized data modeling.
Grid search is a great way to improve the performance of a classifier. I explored the parameter space of both the Decision Tree and Bagging Classifier models to see if I can improve their performance.
The DecisionTreeClassifier Best Score was 0.850 which is not better than before (0.863).
The BaggingClassifier Best Score was 0.935 which is the best we've seen yet.
Next steps should be to create a individualized recommendations. To build a model of user behaviour and see if we can predict whether or not a user would like a certain movie according to what other people have rated.
It is an interesting problem to look at whether a movie will be successful in a certain community, and we can model it quite effectively. However, it would be constructive if we could get each user's rating for each movie.
Hope you enjoy my findings :)