We take a look at the billboard top 100 data from the year 2000.
What is the likelihood of a song hitting number 1?
Are different genres more likely to hit Number 1 than others?
Have all genres hit Number 1?
Cleaning the data
I started by cleaning the data. It was only necessary to clean the data that would answer my questions.
The first thing wrong with our data was the null data. It was populated with '*' instead. Let's replace that with np.nan instead:
Next was the track length. It was parsed in as time of day rather than track length. An easy split and replace should fix that:
Next was to drop any columns of data we had that was all nan values. We do not need that data.
Last we had to delete any meaningless spaces in certain data etc.
Getting the data I need
I only wanted the data of tracks that were in number one at some point during their appearance on the top 100.
I got the data of the weeks all the songs were on the charts and which spot they held.
I then extracted all the data that had the float 1. in it.
Plotting the data
Luckily we have the handy pandas library to help us visualize some data.
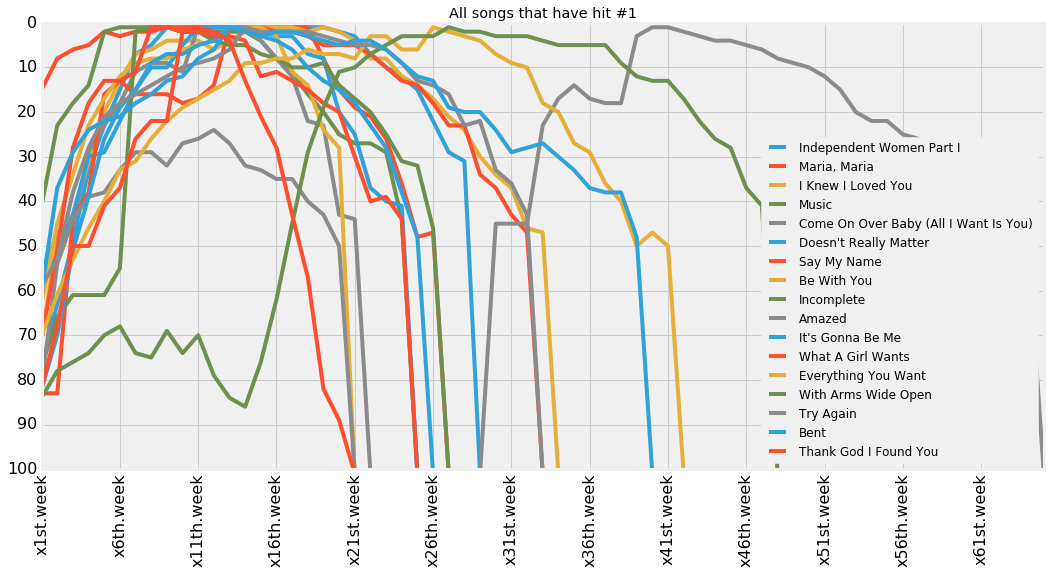
I started by plotting all the songs in a line chart. It was not very useful :(
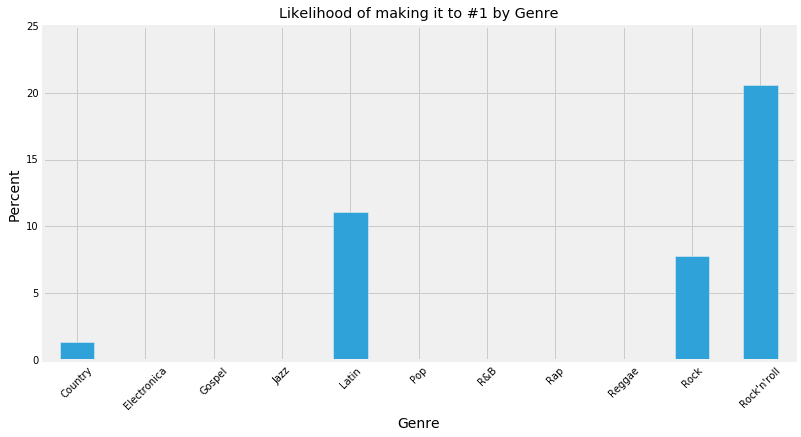
I then decided to group all the songs by genre and check the percentage of songs that hit number one in that genre vs all the songs that got to the top 100 in that genre. Surprisingly, only 'Rock', 'Rock n Roll', 'Latin', and 'Country' made it to the number one spot in the year 2000.
This is a a little difficult to read. Why dont we put it into a stacked bar graph to see the weight of each genre and the songs in that genre hitting Number 1.
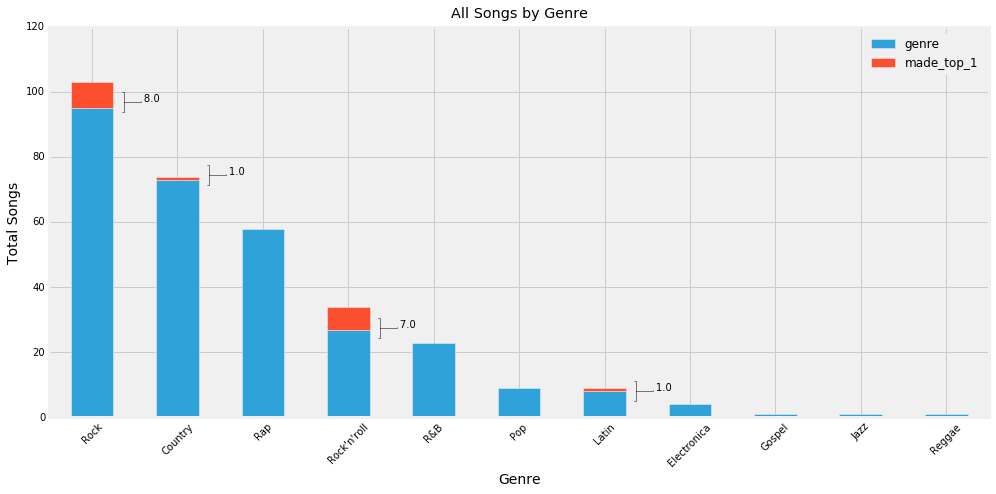
This is more like it! We can see the weight of the rock and roll genre. Of all songs that made it to the top 100, if that song were a rock n roll song, it was much more likely to make it to number 1 than songs in any other genre
What else can we do? Why don't we look at the average of the rock and rock and roll genre performances by week and compare them. I chose to remove the 'latin' and 'country' genres from this graph because both genres only have 1 song that hit number 1 at some point.
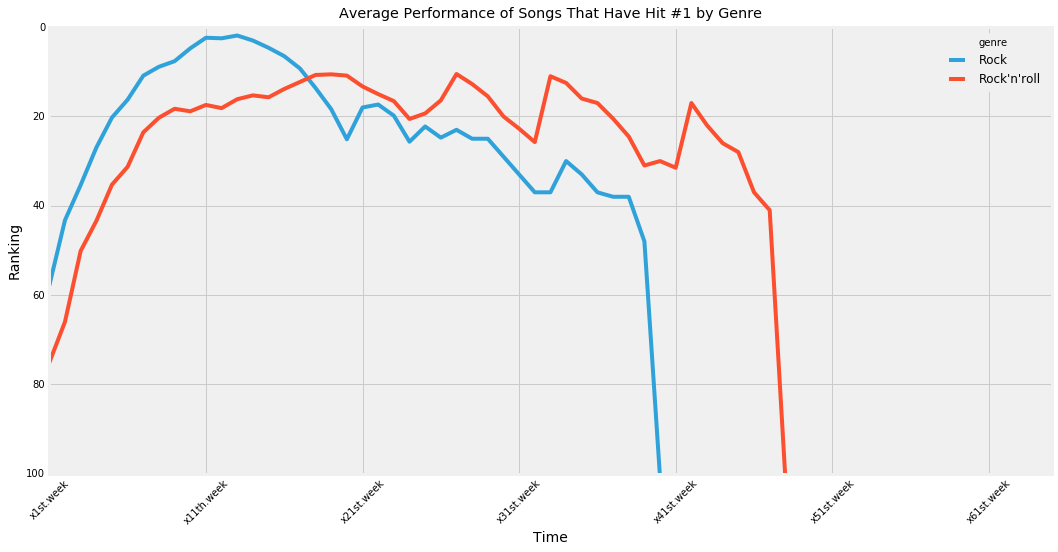
Interesting! The bar chart of average performance of tracks that have hit number one by genre shows us a few things.
- Rock tracks peak faster than rock n roll tracks.
- Rock n roll tracks stay on the charts for longer
- Rock tracks are more popular (meaning they average closer to number one than rock n roll)
Hope you enjoy my findings :)